Automated Fantasy Baseball Research Using Python, Pandas, and Seaborn
Winning Fantasy Baseball in Style
The advantages of doing my pre-season due diligence by scouting out the best fantasy baseball players often evaporates about 3 rounds into the draft. Since I can’t win in the draft, why not automate my in-season scouting efforts?
Getting Data
For a good system, there are three inputs:
- Roster data to know who is available.
- Projections to see who is slated to do well.
- Mid-season player statistics to so who’s currently doing well.
1 — Roster Data
Our team uses ESPN for our league, which happens to allow access to webpages so long as you take the time to make the league public. Getting roster data is fairly straightforward; all you need to do is scrape the rosters page for that league ID. This is an example of that:
import requests
import csv
from bs4 import BeautifulSoup

# rip your league id from your espn url
league_id = 1234567890
LEAGUE_URL = "http://games.espn.com/flb/leaguerosters?leagueId={}"
html = requests.get(LEAGUE_URL.format(league_id)).text

# parse the page to return the rosters table
soup = BeautifulSoup(html)
rosters = soup.find_all("table", {'class': 'playerTableTable'})

# loop through the rosters table and get all of the associated values
players = []
for roster in rosters:
    team_name = roster.find("a").text
    players_html = roster.find_all("td", {'class': 'playertablePlayerName'})
    for player in players_html:

        # parse player info, remove asterisks for injured players.
        player_name = player.text.split(",")[0]
        player_name = player_name.replace("*", "")

        # add to output list
        players.append([player_name, team_name])

# write out to a csv
with open("rosters.csv", "w", newline='') as out_file:
    writer = csv.writer(out_file)
    writer.writerow(("player", "team"))
    writer.writerows(players)
2 — Projections
Player projections are common source of scouting information for our league. Since we do not use the standard scoring rules, the projections from ESPN are mostly worthless to us (not that they’re particularly valuable otherwise). For my own purposes, I like the Depth Charts projection system that they use, which is a combination of two other common projection systems (ZiPS and Steamer) weighted by an in-house projection for playing time.
Getting Data with cURL (Update: No Longer Necessary)
The following is no longer accurate. Fangraphs has since transitioned to being a Next.js site and stores all of their data in a single HTML <style> tag with the standard __NEXT_DATA__ id value. Have at it!
The original method I used is below here.
There were two issues I was trying to solve for.
- Not enough players - URL parameters & form fields didn’t seem to contain an ability to get more than 50 players at once.
- Confusing ASP.net forms - These use built-in Microsoft libraries that send back somewhere between 50-60kb of base64-encoded page state data, which is a lot of added noise for my purposes.
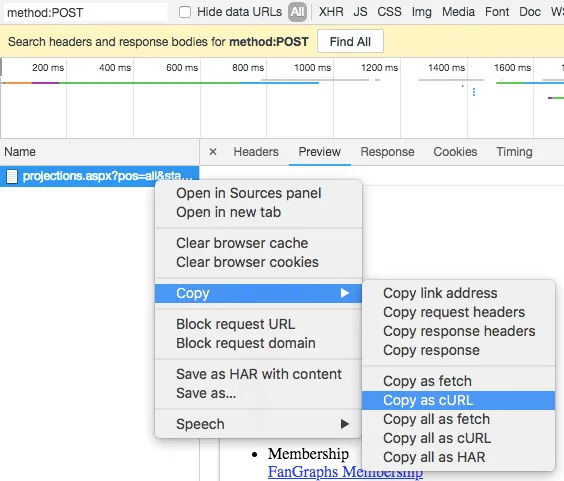
Using the network tab, I found that the link for ‘page size’ allowed me to request higher amounts of players than the values in the form dropdown.
- Navigate to the chrome developer tools network tab.
- Filter to
method:POSTso you only get the form post and none of the other resource requests. - Right click on the post and select
copy>copy as cURL (bash).
I ripped that data out into two files, get_fangraphs.sh (send the request), and fangraphs_form_data.txt. Since the data is over a certain volume with curl, you need to store it in its own file and load it using the -d flag.
# get batters projections html
curl 'https://www.fangraphs.com/projections.aspx?pos=all&stats=bat&type=rfangraphsdc' \
    -H 'Accept-Encoding: gzip, deflate, br' \
    -H 'Accept-Language: en-US,en;q=0.9' \
    -H 'Upgrade-Insecure-Requests: 1' \
    -H 'Content-Type: application/x-www-form-urlencoded' \
    -H 'Accept: text/html,application/xhtml+xml,application/xml;q=0.9,image/webp,image/apng,*/*;q=0.8' \
    -d @batters_form_data.txt --compressed \
    > batters_projections.html

# get pitching projections
curl 'https://www.fangraphs.com/projections.aspx?pos=all&stats=pit&type=rfangraphsdc' \
    -H 'Accept-Encoding: gzip, deflate, br' \
    -H 'Accept-Language: en-US,en;q=0.9' \
    -H 'Upgrade-Insecure-Requests: 1' \
    -H 'Content-Type: application/x-www-form-urlencoded' \
    -H 'Accept: text/html,application/xhtml+xml,application/xml;q=0.9,image/webp,image/apng,*/*;q=0.8' \
    -d @pitchers_form_data.txt --compressed \
    > pitchers_projections.html
In the (batters|pitchers)_form_data.txt file, there was one adjustment to make to get a higher number than 50 entries back: __EVENTARGUMENT=FireCommand:ProjectionBoard1$dg1$ctl00;PageSize;50 - change this 50 to something like 2500 or so.
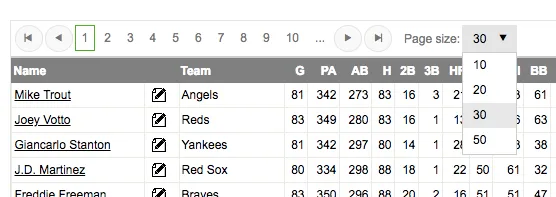
Voila! You’ve now got a page with the HTML table containing all of the projections information there is to want. You can then plug use pandas’ read_html() function to parse this output for you.
3 — Actuals
In addition to projections, having in-season results helps improve our judgment and add context to the projections. There are players whom are specifically favored by the projection systems (namely, players with long histories), and players who are treated rather unkindly (small sample sizes).
Getting the ongoing statistics on a per-player basis turned out to be much easier than anything related to the projections. With a little manipulation of URL parameters, you can easily create a page for scraping that contains all of the necessary information in one go.
Creating a short script to parse out player rows and add them to another csv for consumption later on turned out to be short work once I figured this bit out. Here’s the script I used (uses requests and beautifulsoup, similar to above):
import requests
import csv
import datetime
from bs4 import BeautifulSoup

# static urls
season = datetime.datetime.now().year
PITCHERS_URL = "https://www.fangraphs.com/leaders.aspx?pos=all&stats=pit&lg=all&qual=0&type=c,36,37,38,40,-1,120,121,217,-1,24,41,42,43,44,-1,117,118,119,-1,6,45,124,-1,62,122,13&season={season}&month=0&season1={season}&ind=0&team=0&rost=0&age=0&filter=&players=0&page=1_100000".format(season=season)
BATTERS_URL = "https://www.fangraphs.com/leaders.aspx?pos=all&stats=bat&lg=all&qual=0&type=8&season={season}&month=0&season1={season}&ind=0&team=0&rost=0&age=0&filter=&players=0&page=1_10000".format(season=season)

# request the data
pitchers_html = requests.get(PITCHERS_URL).text
batters_html = requests.get(BATTERS_URL).text

def parse_array_from_fangraphs_html(input_html, out_file_name):
    """
    Take a HTML stats page from fangraphs and parse it out to a CSV file.
    """
    # parse input
    soup = BeautifulSoup(input_html, "lxml")
    table = soup.find("table", {"class": "rgMasterTable"})

    # get headers
    headers_html = table.find("thead").find_all("th")
    headers = []
    for header in headers_html:
        headers.append(header.text)
    print(headers)

    # get rows
    rows = []
    rows_html = table.find("tbody").find_all("tr")
    for row in rows_html:
        row_data = []
        for cell in row.find_all("td"):
            row_data.append(cell.text)
        rows.append(row_data)

    # write to CSV file
    with open(out_file_name, "w") as out_file:
        writer = csv.writer(out_file)
        writer.writerow(headers)
        writer.writerows(rows)

parse_array_from_fangraphs_html(batters_html, 'batters_actuals.csv')
parse_array_from_fangraphs_html(pitchers_html, 'pitchers_actuals.csv')
Normally, I would use pandas read_html function for parsing HTML tables like this (which uses lxml internally, same as BeautifulSoup), but the encoding of this table caused enough havoc that I decided to write the parser myself. If you’re in a similar scenario, try that method first!
Reading the Data Into Pandas
Pandas is very capable of producing these sorts of analyses using tabular data in a straightforward, repeatable manner. Our league uses a customized stat list to base our categories on, so we have to derive many of these after getting actuals/projections.
Batting Stats
- HR: Home Runs
- K: Strikeouts
- RC: Runs Created (AB * OBP * SLG)
- OBP: On Base Percentage
- SLG: Slugging Percentage
Pitching Stats
- HR: Home Runs Against
- K: Strikeouts
- ERA: Earned Run Average
- QS: Quality Starts
- OBA: On-Base Percentage Against
! There are plenty of different scoring methods used in fantasy. If you want to try this on yours, you can edit the code to use your own categories instead.
Pandas
Bringing this all into pandas is relatively easy, because of its insanely useful read_csv() function. Not only does this do your opening/reading for you, it almost always gets the data types correct as well.
# read in all outputs
df_rost = pd.read_csv('rosters.csv')
dfb_act = pd.read_csv('batters_actuals.csv')
dfp_act = pd.read_csv('pitchers_actuals.csv')

# create a function to parse out percentage strings to floats
def parse_pctg(value):
    return float(value.split()[0]) / 100

# apply that to all percentage values in the dataframes
dfb_act['BB%'] = dfb_act['BB%'].apply(lambda x: parse_pctg(x))
dfb_act['K%'] = dfb_act['K%'].apply(lambda x: parse_pctg(x))
dfp_act['K%'] = dfp_act['K%'].apply(lambda x: parse_pctg(x))
dfp_act['BB%'] = dfp_act['BB%'].apply(lambda x: parse_pctg(x))
dfp_act['K-BB%'] = dfp_act['K-BB%'].apply(lambda x: parse_pctg(x))
dfp_act['LOB%'] = dfp_act['LOB%'].apply(lambda x: parse_pctg(x))

with open('batters_projections.html', 'r') as bhtml:
    btxt = bhtml.read()
    dfb_proj = pd.read_html(btxt)[-1]  # read_html returns ALL tables, we just want the last one.
    dfb_proj.dropna(axis=1, inplace=True)

with open('pitchers_projections.html', 'r') as phtml:
    ptxt = phtml.read()
    dfp_proj = pd.read_html(btxt)[-1]
    dfp_proj.dropna(axis=1, inplace=True)

# list of data sets: df_rost, dfb_act, dfb_proj, dfp_act, dfp_proj
This means we’ve got 5 inputs - one for rosters, two for projections, and two for actuals. Time to get crankin’ on the analysis part!
Joining It Into One
First we need to join the datasets together into two dataframes that will make things easier to use: batters and pitchers. Roster information goes into both.
# merge batters into one 'dfb' Dataframe
dfb = pd.merge(dfb_proj, df_rost, how='left', on='Name', suffixes=('.p', '.r'))
dfb = pd.merge(dfb, dfb_act, how='left', on='Name', suffixes=('', '.a'))

# merge pitchers into one 'dfp' dataframe
dfp = pd.merge(dfp_proj, df_rost, how='left', on='Name', suffixes=('.p', '.r'))
dfp = pd.merge(dfp, dfp_act, how='left', on='Name', suffixes=('', '.a'))
Now you’ve got a working dataset! I keep the updated code for generating these on Github as part of my generic Airflow scripts repo if you want to play around with it. It’s mostly built for the stats that we care about, so feel free to customize to your liking.